Market Outlook
September 14, 2016
Market Cues
Domestic Indices
Chg (%)
(Pts)
(Close)
Indian markets are likely to open negative taking global cues
BSE Sensex
(1.5)
(444)
28,354
Nifty
(1.7)
(151)
8,716
Following the recovery rally seen in the previous session, US markets showed a
significant move back to the downside during trading on Tuesday. Continued
Mid Cap
(2.9)
(393)
12,952
uncertainty about the outlook for interest rates weighed on the markets ahead of
Small Cap
(2.3)
(302)
12,560
next week's Federal Reserve meeting.
Bankex
(2.4)
(556)
22,694
European markets finished lower on Tuesday as sentiment was hit by a sharp fall in
the oil price, while investors speculated over when the U.S. Federal Reserve would
Global Indices
Chg (%)
(Pts)
(Close)
raise interest rates.
Dow Jones
(1.4)
(258)
18,067
Indian shares fell more than 1.5% on Monday, tracking broader Asian markets
Nasdaq
(1.1)
(57)
5,155
lower, on revived prospects that the U.S. Federal Reserve might raise interest rates as
FTSE
(0.5)
(35)
6,666
early as next week.
Nikkei
(1.7)
(293)
16,673
News Analysis
Hang Seng
(3.4)
(809)
23,291
Review - Coal India, Godfrey Phillips
Shanghai Com
(1.8)
(57)
3,022
Detailed analysis on Pg2
Investor’s Ready Reckoner
Advances / Declines
BSE
NSE
Key Domestic & Global Indicators
Advances
688
249
Stock Watch: Latest investment recommendations on 150+ stocks
Declines
2,055
1,375
Refer Pg5 onwards
Unchanged
169
58
Top Picks
CMP
Target
Upside
Volumes (` Cr)
Company
Sector
Rating
(`)
(`)
(%)
BSE
3,429
Amara Raja Batteries Auto & Auto Ancillary
Buy
985
1,174
19.2
NSE
21,136
HCL Tech
IT
Buy
783
1,000
27.8
Bharat Electronics
Capital Goods
Buy
1,200
1,414
17.8
Equitas Holdings
Financials
Buy
176
235
33.8
Net Inflows (` Cr)
Net
Mtd
Ytd
Navkar Corporation Others
Buy
195
265
35.6
FII
(337)
1,918
42,586
More Top Picks on Pg3
MFs
(222)
(655)
9,454
Key Upcoming Events
Previous
Consensus
Date
Region
Event Description
Top Gainers
Price (`)
Chg (%)
Reading
Expectations
Sep 14 US
Initial Jobless claims
259.0
265.0
Cyient
492
7.0
Sep 14 UK
Jobless claims change
(8.6)
1.8
Trent
242
3.1
Sep 15 India
Monthly Wholesale Prices YoY%
3.6
4.0
Fincables
432
2.5
Sep 15 Euro Zone
Euro Zone CPI (YoY)
0.2
0.2
Star
1,007
2.4
Sep 15 US
Industrial Production
0.7
(0.2)
Deltacorp
157
2.4
Sep 15 UK
BOE Announces rates
0.3
0.3
6.(
More Events on Pg4
Top Losers
Price (`)
Chg (%)
Rdel
56
(13.5)
Hdil
90
(10.9)
Hindalco
141
(9.0)
Dlf
145
(8.1)
Il&Fstrans
88
(7.5)
As on September 12, 2016
Market Outlook
September 14, 2016
News Analysis
Review
Coal India
Coal India reported ~15% fall in consolidated net profit at `3,065.28cr for the
quarter ended June 30, 2016, due to decline in sales. Coal India (CIL) had posted
a consolidated net profit of `3,596.93cr in the year-ago period. Consolidated
profit includes profit of jointly controlled entities and associates. Net sales of the
company during the quarter declined by ~6% to `17,796.05cr. Its production
during the quarter increased by ~4% to 125.67 million tonnes (MT) compared to
121.35 MT in the same quarter of previous fiscal. Coal India accounts for over
80% of domestic coal production. The government has set a production target of
598 million tonnes for CIL for the ongoing fiscal.
Godfrey Phillips
Cigarette maker Godfrey Phillips India (GPI) on Tuesday reported a ~62% decline
in its standalone net profit at `22.38cr for the first quarter ended June 30, due to
lower income from operations. The company had reported a standalone net profit
of `58.88cr in the same quarter a year ago. Godfrey Phillips' total income from
operations during the April-June quarter stood at `940.56cr as compared to
`1,069.51cr in the same period of last financial year.
Economic and Political News
Railways to save `10,000 crore after budget merger
August CPI falls to 5.05 % ; July IIP shrinks by 2.4 %
Food processing sector to treble in coming years: Harsimrat Kaur Badal
Corporate News
HCC bags `182 crore from Department of Atomic Energy
Reliance Capital to list home finance biz; eyes `50k cr loan book
Manappuram Finance raises `200 crore via NCDs
Quarterly Bloomberg Brokers Consensus Estimate
Reliance Communication Ltd Consol - Sept 14, 2016
Particulars (` cr)
1QFY17E
1QFY16
y-o-y (%)
4QFY16 q-o-q (%)
Net sales
5,551
5,429
2.2
5,579
(0.5)
EBITDA
1,774
1,827
(2.9)
1,657
7.0
EBITDA margin (%)
32.0
33.7
(130.7)
29.7
Net profit
95
177
(46.2)
177
(46.2)
GMR Infrastructure Ltd - Sept 14, 2016
Particulars (` cr)
1QFY17E
1QFY16
y-o-y (%)
4QFY16 q-o-q (%)
Net sales
2,681
2,928
(8.4)
3,708
(27.7)
EBITDA
1,082
863
25.5
1,109
(2.4)
EBITDA margin (%)
40.4
29.5
(302.0)
29.9
Net profit
(695)
(429)
0.0
(954)
0.0
Market Outlook
September 14, 2016
Top Picks ★★★★★
Large Cap
Market Cap
CMP
Target
Upside
Company
Rationale
(` Cr)
(`)
(`)
(%)
To outpace battery industry growth due to better technological
Amara Raja Batteries
16,830
985
1,174
19.2
products leading to market share gains in both the automotive
OEM and replacement segments.
Uptick in defense capex by government when coupled with BELs
Bharat Electronics
28,798
1,200
1,414
17.8
strong market positioning, indicate that good times are ahead
for BEL.
The stock is trading at attractive valuations and is factoring all
HCL Tech
1,10,392
783
1,000
27.8
the bad news.
Back on the growth trend, expect a long term growth of 14% to
Infosys
2,42,098
1,054
1,370
30.0
be a US$20bn in FY2020.
Source: Company, Angel Research
Mid Cap
Market Cap
CMP
Target
Upside
Company
Rationale
(` Cr)
(`)
(`)
(%)
Among the top 4 players in the consumer durables segment.
Bajaj Electricals
2,735
271
306
13.1
Improved profitability backed by turn around in E&P segment.
Strong order book lends earnings visibility.
Favourable outlook for the AC industry to augur well for
Cooling products business which is out pacing the market
Blue Star
4,858
510
578
13.4
growth. EMPPAC division's profitability to improve once
operating environment turns around.
With a focus on the low and medium income (LMI) consumer
Dewan Housing Finance
8,113
278
325
16.9
segment, the company has increased its presence in tier-II & III
cities where the growth opportunity is immense.
Strong loan growth backed by diversified loan portfolio and
Equitas Holdings
5,889
176
235
33.8
adequate CAR. ROE & ROA likely to remain decent as risk of
dilution remains low. Attractive valuations considering growth.
Expectations of above average monsoon augurs well for
Goodyear India
1,361
590
684
15.9
Goodyear India as it derives ~50% of its turnover from farm
tyre segment.
Economic recovery to have favourable impact on advertising &
circulation revenue growth. Further, the acquisition of a radio
Jagran Prakashan
6,185
189
225
18.9
business (Radio City) would also boost the company's revenue
growth.
Speedier execution and speedier sales, strong revenue visibilty
Mahindra Lifespace
1,759
429
522
21.8
in short-to-long run, attractive valuations
Massive capacity expansion along with rail advantage at ICD
Navkar Corporation
2,787
195
265
35.6
as well CFS augurs well for the company
Earnings boost on back of stable material prices and
Radico Khaitan
1,377
104
125
20.8
favourable pricing environment. Valuation discount to peers
provides additional comfort
Strong brands and distribution network would boost growth
Siyaram Silk Mills
1,158
1,235
1,469
18.9
going ahead. Stock currently trades at an inexpensive
valuation.
Market leadership in Hindi news genre and no. 2 viewership
ranking in English news genre, exit from the radio business,
TV Today Network
1,778
298
363
21.8
and anticipated growth in ad spends by corporates to benefit
the stock.
Source: Company, Angel Research
Market Outlook
September 14, 2016
Key Upcoming Events
Result Calendar
Date
Company
Sep 14, 2016
Monnet Ispat, CESC, Unitech, Anant Raj
Source: Bloomberg, Angel Research
Global economic events release calendar
Date
Time
Country
Event Description
Unit
Period
Bloomberg Data
Last Reported Estimated
Sep 14, 2016
6:00PM
US
Initial Jobless claims
Thousands
Sep 10
259.00
265.00
2:00PM
UK
Jobless claims change
% Change
Aug
(8.60)
1.80
Sep 15, 2016
12:00PM
India
Monthly Wholesale Prices YoY%
% Change
Aug
3.55
4.00
2:30PM
Euro Zone
Euro-Zone CPI (YoY)
%
Aug F
0.20
0.20
6:45PM
US
Industrial Production
%
Aug
0.74
(0.20)
US
Producer Price Index (mom)
% Change
Aug
(0.50)
--
4:30PM
UK
BOE Announces rates
% Ratio
Sep 15
0.25
0.25
Sep 16, 2016
6:00PM
US
Consumer price index (mom)
% Change
Aug
--
0.10
Sep 20, 2016
6:00PM
US
Housing Starts
Thousands
Aug
1,211.00
1,193.00
6:00PM
US
Building permits
Thousands
Aug
1,144.00
1,177.00
Sep 21, 2016
11:30PM
US
FOMC rate decision
%
Sep 21
0.50
0.50
Sep 22, 2016
7:30PM
Euro Zone
Euro-Zone Consumer Confidence
Value
Sep A
(8.50)
--
1:00PM
Germany
PMI Services
Value
Sep P
51.70
--
Sep 23, 2016
7:30PM
US
Existing home sales
Million
Aug
5.39
5.45
1:00PM
Germany
PMI Manufacturing
Value
Sep P
53.60
--
Sep 26, 2016
7:30PM
US
New home sales
Thousands
Aug
654.00
580.00
Sep 27, 2016
7:30PM
US
Consumer Confidence
S.A./ 1985=100
Sep
101.10
98.00
Sep 29, 2016
1:25PM
Germany
Unemployment change (000's)
Thousands
Sep
(7.00)
--
6:00PM
US
GDP Qoq (Annualised)
% Change
2Q T
1.10
1.30
Sep 30, 2016
2:00PM
UK
GDP (YoY)
% Change
2Q F
2.20
--
Source: Bloomberg, Angel Research
Market Outlook
September 14, 2016
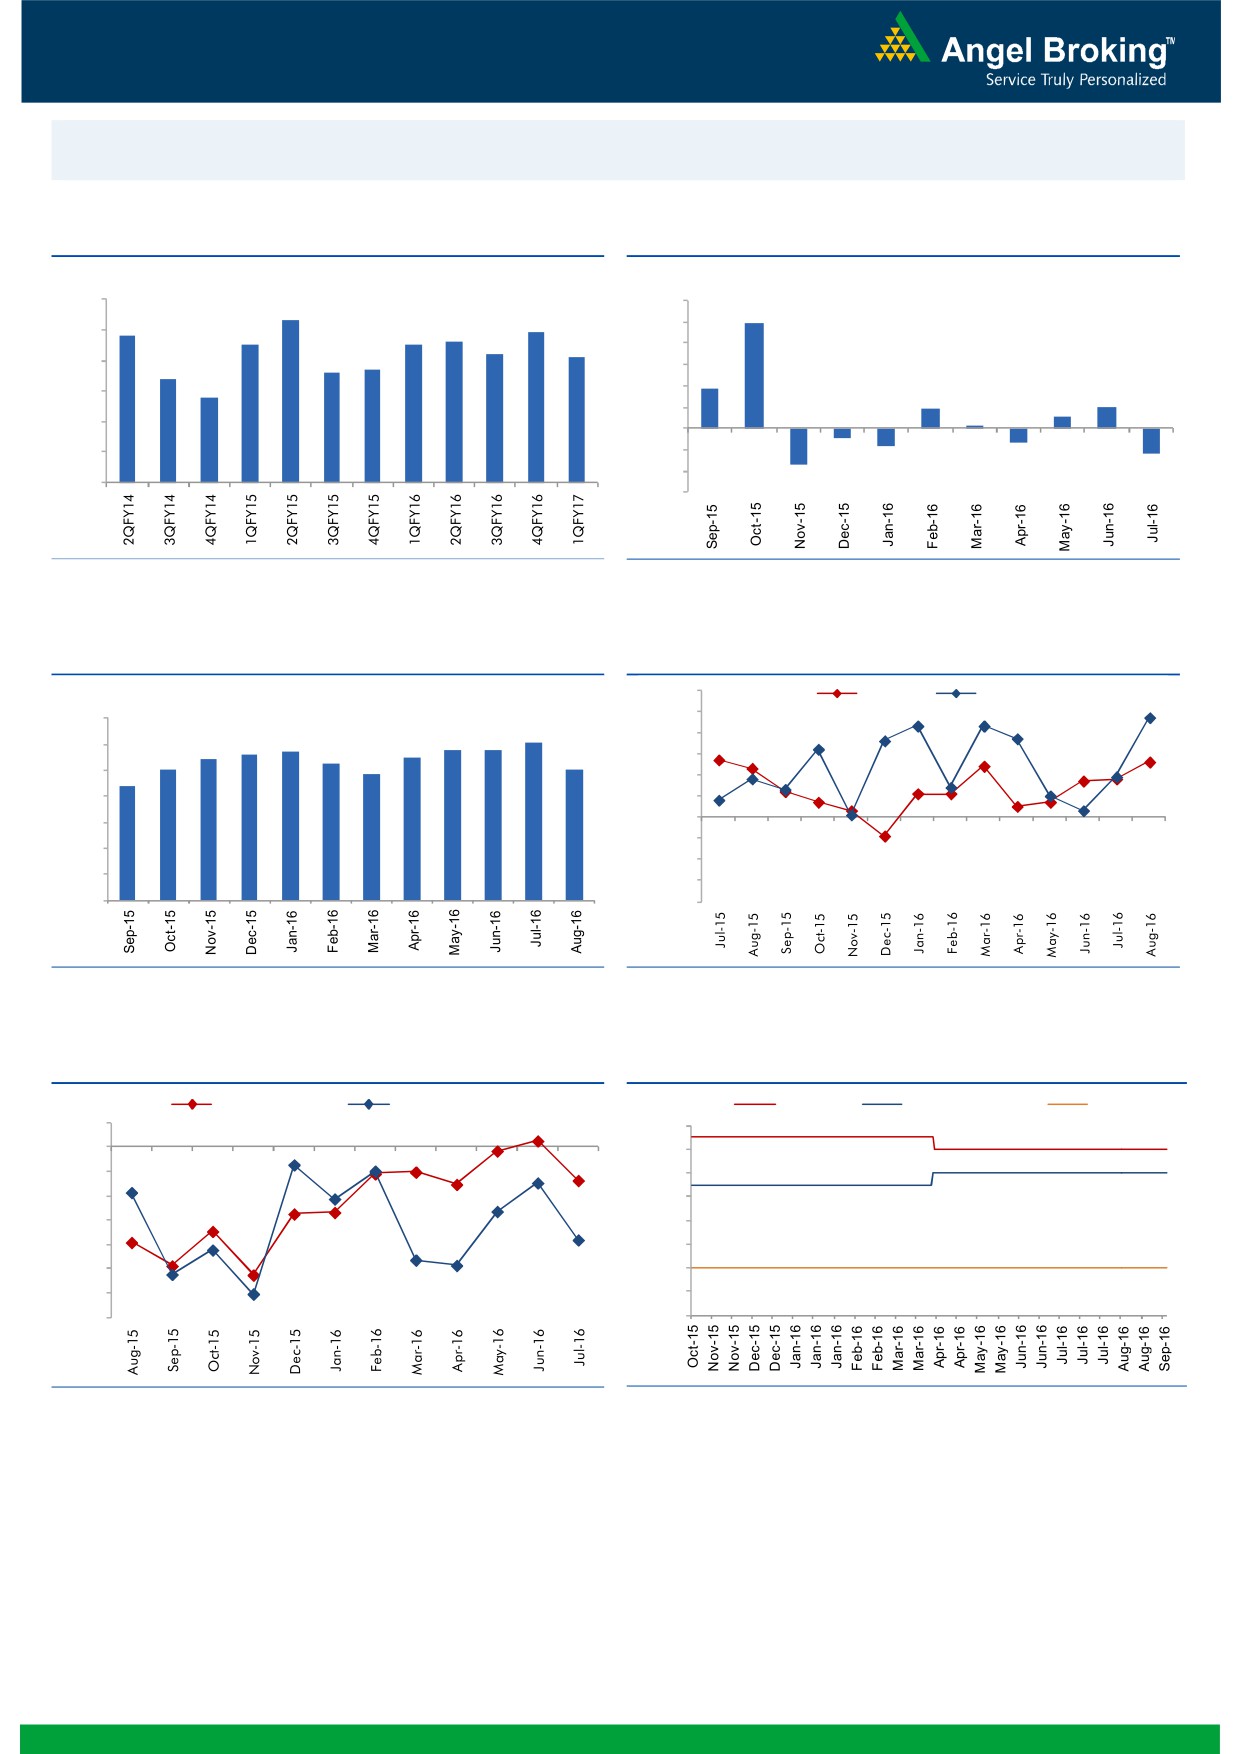
Macro watch
Exhibit 1: Quarterly GDP trends
Exhibit 2: IIP trends
(%)
(%)
9.0
12.0
8.3
9.9
7.8
7.9
8.0
7.5
7.5
7.6
10.0
7.2
7.1
8.0
6.6
6.7
7.0
6.4
6.0
3.7
5.8
6.0
4.0
1.9
2.0
1.1
2.0
0.3
5.0
-
4.0
(2.0)
(0.9)
(1.6)
(1.3)
(4.0)
(2.4)
3.0
(3.4)
(6.0)
Source: CSO, Angel Research
Source: MOSPI, Angel Research
Exhibit 3: Monthly CPI inflation trends
Exhibit 4: Manufacturing and services PMI
56.0
Mfg. PMI
Services PMI
(%)
55.0
7.0
6.1
5.6
5.7
5.8
5.8
54.0
6.0
5.4
5.5
5.0
5.3
5.1
53.0
4.8
5.0
4.4
52.0
4.0
51.0
50.0
3.0
49.0
2.0
48.0
1.0
47.0
-
46.0
Source: MOSPI, Angel Research
Source: Market, Angel Research; Note: Level above 50 indicates expansion
Exhibit 5: Exports and imports growth trends
Exhibit 6: Key policy rates
(%)
Exports yoy growth
Imports yoy growth
(%)
Repo rate
Reverse Repo rate
CRR
5.0
7.00
0.0
6.50
(5.0)
6.00
(10.0)
5.50
(15.0)
5.00
(20.0)
4.50
(25.0)
4.00
(30.0)
3.50
(35.0)
3.00
Source: Bloomberg, Angel Research
Source: RBI, Angel Research
Market Outlook
September 14, 2016
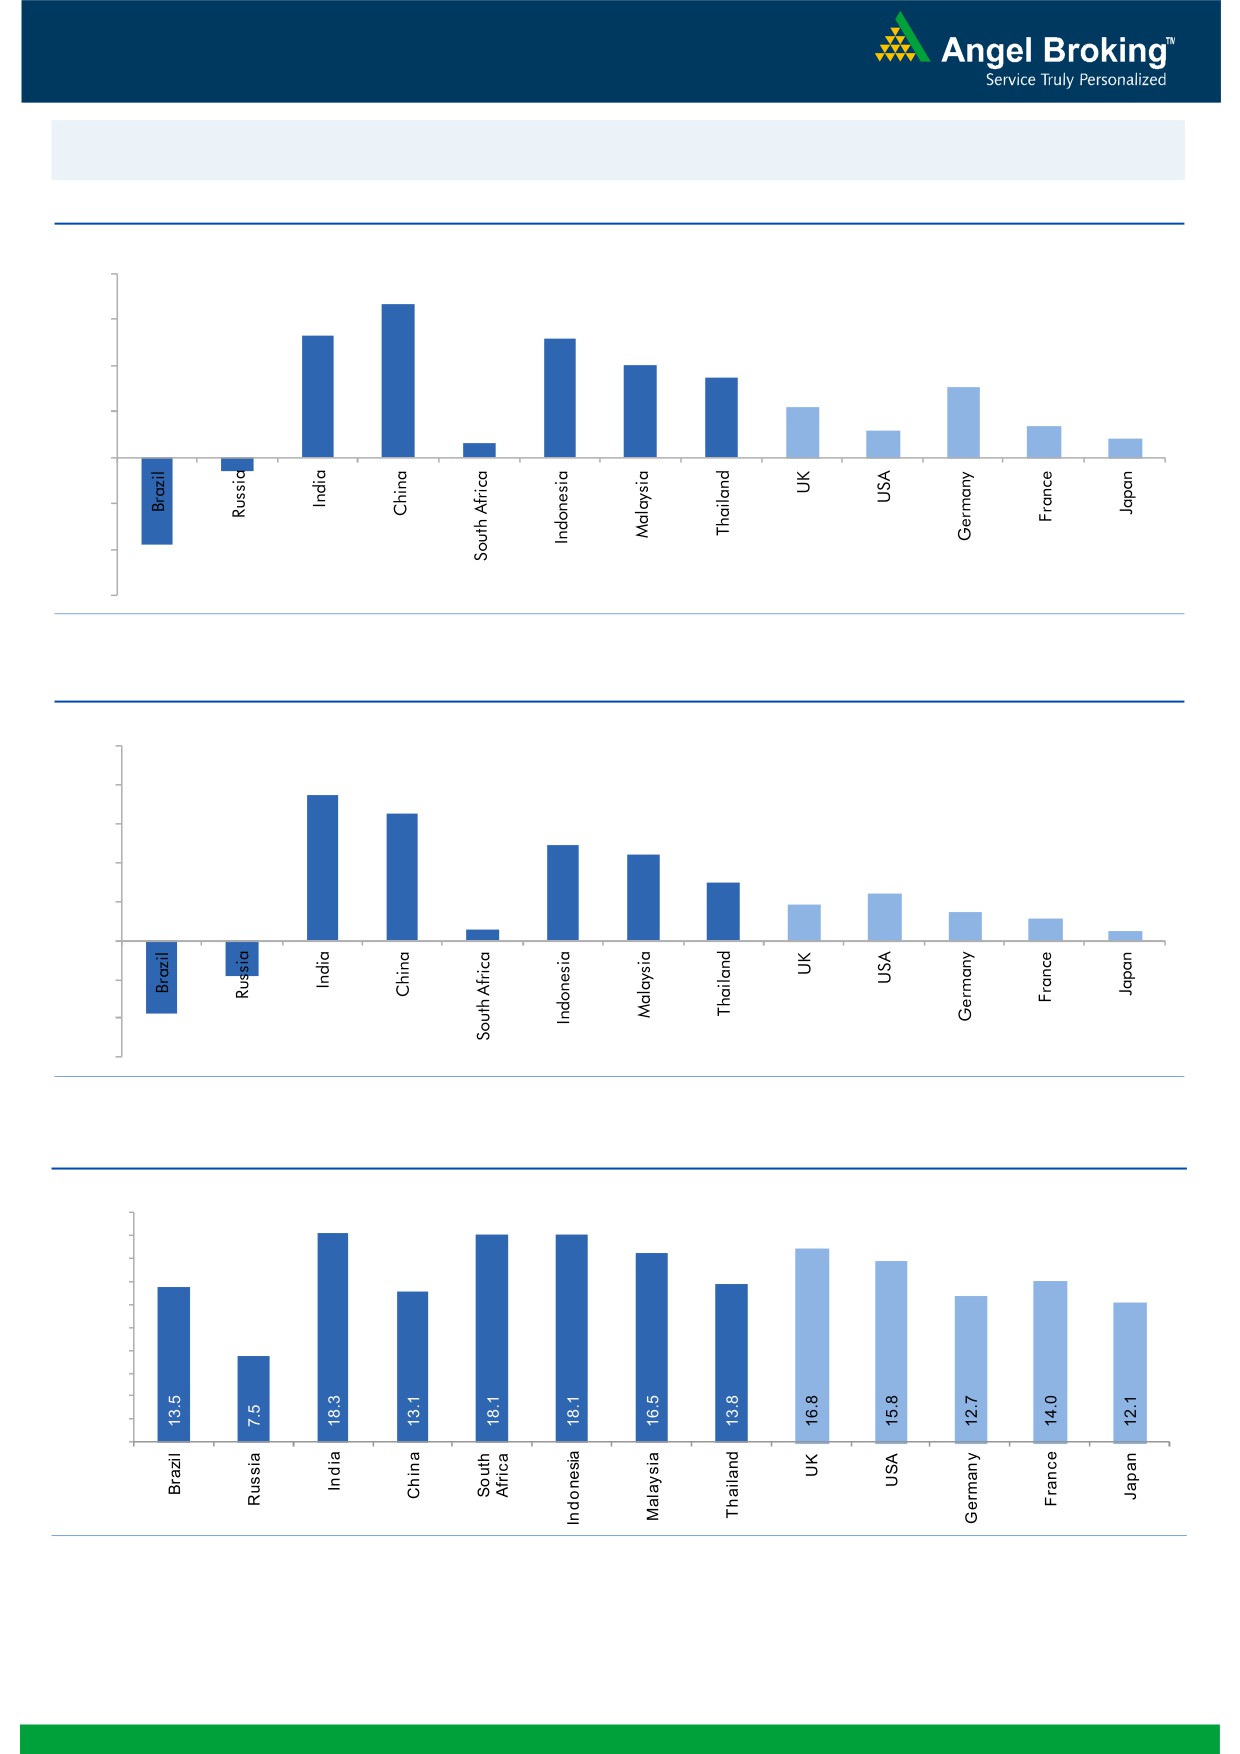
Global watch
Exhibit 1: Latest quarterly GDP Growth (%, yoy) across select developing and developed countries
(%)
8.0
6.7
6.0
5.3
0.6
5.2
4.0
3.5
4.0
3.1
2.2
1.4
2.0
1.2
0.8
-
(2.0)
(0.6)
(4.0)
(3.8)
(6.0)
Source: Bloomberg, Angel Research
Exhibit 2: 2016 GDP Growth projection by IMF (%, yoy) across select developing and developed countries
(%)
10.0
7.5
8.0
6.5
6.0
4.9
4.4
4.0
3.0
2.4
1.9
1.5
2.0
1.1
0.6
0.5
(3.8)
(1.8)
-
(2.0)
(4.0)
(6.0)
Source: IMF, Angel Research
Exhibit 3: One year forward P-E ratio across select developing and developed countries
(x)
20.0
18.0
16.0
14.0
12.0
10.0
8.0
6.0
4.0
2.0
-
Source: IMF, Angel Research
Market Outlook
September 14, 2016
Exhibit 4: Relative performance of indices across globe
Returns (%)
Country
Name of index
Closing price
1M
3M
1YR
Brazil
Bovespa
58,586
(2.5)
16.8
21.5
Russia
Micex
2,005
1.9
6.1
16.7
India
Nifty
8,716
0.4
6.2
12.9
China
Shanghai Composite
3,024
(3.6)
4.9
(5.0)
South Africa
Top 40
46,275
1.3
(1.6)
5.1
Mexico
Mexbol
46,154
(4.6)
2.5
6.7
Indonesia
LQ45
895
(5.2)
3.7
18.0
Malaysia
KLCI
1,677
0.2
1.2
4.6
Thailand
SET 50
925
(6.6)
1.2
3.1
USA
Dow Jones
18,067
(2.9)
1.9
8.8
UK
FTSE
6,666
(3.6)
12.5
7.0
Japan
Nikkei
16,729
(1.1)
4.4
(7.6)
Germany
DAX
10,387
(3.1)
8.1
1.5
France
CAC
4,387
(2.5)
5.2
(0.9)
Source: Bloomberg, Angel Research
Stock Watch
September 14, 2016
Company Name
Reco
CMP
Target
Mkt Cap
Sales ( Čcr )
OPM(%)
EPS (Č)
PER(x)
P/BV(x)
RoE(%)
EV/Sales(x)
(Č)
Price ( Č)
( Č cr )
FY17E FY18E
FY17E
FY18E
FY17E
FY18E
FY17E
FY18E
FY17E
FY18E
FY17E
FY18E
FY17E
FY18E
Agri / Agri Chemical
Rallis
Neutral
219
-
4,263
1,937
2,164
13.3
14.3
9.0
11.0
24.4
19.9
4.2
3.7
18.4
19.8
2.2
2.0
United Phosphorus
Accumulate
647
684
32,803
15,176
17,604
18.5
18.5
37.4
44.6
17.3
14.5
3.4
2.8
21.4
21.2
2.3
1.9
Auto & Auto Ancillary
Ashok Leyland
Buy
84
111
23,763
22,407
26,022
10.6
10.6
5.2
6.4
16.0
13.0
3.6
3.1
23.6
24.7
1.1
1.0
Bajaj Auto
Neutral
2,955
-
85,517
25,093
27,891
19.5
19.2
143.9
162.5
20.5
18.2
5.8
5.0
30.3
29.4
3.1
2.7
Bharat Forge
Neutral
846
-
19,700
7,726
8,713
20.5
21.2
35.3
42.7
24.0
19.8
4.4
4.0
18.9
20.1
2.6
2.3
Eicher Motors
Neutral
22,741
-
61,768
16,583
20,447
17.5
18.0
598.0
745.2
38.0
30.5
13.0
9.9
41.2
38.3
3.6
2.8
Gabriel India
Neutral
114
-
1,644
1,544
1,715
9.0
9.3
5.4
6.3
21.2
18.2
4.0
3.5
18.9
19.5
1.0
0.9
Hero Motocorp
Neutral
3,529
-
70,471
31,253
35,198
15.3
15.0
172.3
192.1
20.5
18.4
7.5
6.4
38.9
37.0
2.1
1.9
Jamna Auto Industries Neutral
212
-
1,691
1,486
1,620
9.8
9.9
15.0
17.2
14.1
12.3
3.1
2.6
21.8
21.3
1.2
1.1
L G Balakrishnan & Bros Neutral
521
-
818
1,302
1,432
11.6
11.9
43.7
53.0
11.9
9.8
1.7
1.5
13.8
14.2
0.7
0.7
Mahindra and Mahindra Neutral
1,426
-
88,565
46,534
53,077
11.6
11.7
67.3
78.1
21.2
18.3
3.4
3.0
15.4
15.8
1.9
1.6
Maruti
Neutral
5,329
-
160,969
69,186
82,217
14.7
14.4
198.5
241.4
26.8
22.1
5.2
4.2
20.2
20.0
2.0
1.6
Minda Industries
Neutral
291
-
2,306
2,728
3,042
9.0
9.1
68.2
86.2
4.3
3.4
1.0
0.8
23.8
24.3
0.9
0.8
Motherson Sumi
Neutral
314
-
41,475
45,896
53,687
7.8
8.3
13.0
16.1
24.0
19.5
7.8
6.2
34.7
35.4
1.0
0.8
Rane Brake Lining
Neutral
1,231
-
974
511
562
11.3
11.5
28.1
30.9
43.8
39.8
6.7
6.1
15.3
15.0
2.0
1.9
Setco Automotive
Neutral
44
-
586
741
837
13.0
13.0
15.2
17.0
2.9
2.6
0.5
0.4
15.8
16.3
1.2
1.1
Tata Motors
Neutral
554
-
159,994
300,209
338,549
8.9
8.4
42.7
54.3
13.0
10.2
2.1
1.8
15.6
17.2
0.6
0.6
TVS Motor
Neutral
321
-
15,246
13,390
15,948
6.9
7.1
12.8
16.5
25.2
19.4
6.3
5.0
26.3
27.2
1.2
1.0
Amara Raja Batteries
Buy
985
1,174
16,830
5,429
6,471
17.5
17.6
35.3
43.5
27.9
22.7
6.4
5.2
25.3
24.8
3.0
2.4
Exide Industries
Neutral
184
-
15,632
7,439
8,307
15.0
15.0
8.1
9.3
22.7
19.8
3.2
2.8
14.3
16.7
1.7
1.5
Apollo Tyres
Neutral
204
-
10,399
12,877
14,504
14.3
13.9
21.4
23.0
9.5
8.9
1.5
1.3
16.4
15.2
1.0
0.9
Ceat
Accumulate
990
1,119
4,003
7,524
8,624
13.0
12.7
131.1
144.3
7.6
6.9
1.4
1.2
19.8
18.6
0.6
0.5
JK Tyres
Neutral
136
-
3,073
7,455
8,056
15.0
15.0
21.8
24.5
6.2
5.5
1.3
1.1
22.8
21.3
0.5
0.5
Swaraj Engines
Neutral
1,210
-
1,503
660
810
15.2
16.4
54.5
72.8
22.2
16.6
6.9
6.3
31.5
39.2
2.1
1.7
Subros
Neutral
133
-
797
1,488
1,681
11.7
11.9
6.4
7.2
20.8
18.5
2.2
2.0
10.8
11.4
0.8
0.7
Indag Rubber
Neutral
179
-
470
286
326
19.8
16.8
11.7
13.3
15.3
13.4
2.6
2.4
17.8
17.1
1.3
1.1
Capital Goods
ACE
Neutral
43
-
424
709
814
4.1
4.6
1.4
2.1
30.6
20.4
1.3
1.2
4.4
6.0
0.8
0.7
BEML
Accumulate
1,048
1,157
4,364
3,451
4,055
6.3
9.2
31.4
57.9
33.4
18.1
2.0
1.8
6.3
10.9
1.4
1.2
Bharat Electronics
Buy
1,200
1,414
28,798
8,137
9,169
16.8
17.2
58.7
62.5
20.4
19.2
3.2
2.8
44.6
46.3
2.5
2.3
Stock Watch
September 14, 2016
Company Name
Reco
CMP
Target
Mkt Cap
Sales ( Čcr )
OPM(%)
EPS (Č)
PER(x)
P/BV(x)
RoE(%)
EV/Sales(x)
(Č)
Price ( Č)
( Č cr )
FY17E
FY18E
FY17E
FY18E
FY17E
FY18E
FY17E
FY18E
FY17E
FY18E
FY17E
FY18E
FY17E
FY18E
Capital Goods
Voltas
Accumulate
374
407
12,382
6,511
7,514
7.9
8.7
12.9
16.3
29.0
23.0
5.2
4.6
16.7
18.5
1.7
1.4
BGR Energy
Neutral
122
-
881
16,567
33,848
6.0
5.6
7.8
5.9
15.7
20.7
0.9
0.9
4.7
4.2
0.2
0.1
BHEL
Neutral
148
-
36,102
28,797
34,742
-
2.8
2.3
6.9
64.1
21.4
1.1
1.1
1.3
4.8
0.9
0.6
Blue Star
Accumulate
510
578
4,858
4,351
5,024
6.4
7.1
17.2
20.6
29.7
24.7
19.3
16.1
23.1
24.1
1.2
1.0
Crompton Greaves
Neutral
80
-
4,998
5,777
6,120
5.9
7.0
3.3
4.5
24.2
17.7
1.1
1.0
4.4
5.9
0.8
0.7
Greaves Cotton
Neutral
135
-
3,304
1,755
1,881
16.8
16.9
7.8
8.5
17.4
15.9
3.5
3.2
20.6
20.9
1.6
1.4
Inox Wind
Buy
177
286
3,936
5,605
6,267
15.7
16.4
24.8
30.0
7.2
5.9
2.0
1.5
25.9
24.4
0.7
0.6
KEC International
Neutral
127
-
3,271
9,294
10,186
7.9
8.1
9.9
11.9
12.9
10.7
1.9
1.6
15.6
16.3
0.6
0.5
Thermax
Neutral
822
-
9,795
5,421
5,940
7.3
7.3
25.7
30.2
32.0
27.2
3.9
3.5
12.2
13.1
1.7
1.6
VATech Wabag
Buy
553
681
3,013
3,136
3,845
8.9
9.1
26.0
35.9
21.3
15.4
2.7
2.3
13.4
15.9
0.9
0.7
Cement
ACC
Neutral
1,583
-
29,718
11,225
13,172
13.2
16.9
44.5
75.5
35.6
21.0
3.4
3.1
11.2
14.2
2.7
2.3
Ambuja Cements
Neutral
261
-
51,766
9,350
10,979
18.2
22.5
5.8
9.5
45.0
27.4
3.8
3.4
10.2
12.5
5.5
4.7
India Cements
Neutral
142
-
4,373
4,364
4,997
18.5
19.2
7.9
11.3
18.0
12.6
1.3
1.3
8.0
8.5
1.8
1.5
JK Cement
Neutral
788
-
5,512
4,398
5,173
15.5
17.5
31.2
55.5
25.3
14.2
3.0
2.6
12.0
15.5
1.8
1.5
J K Lakshmi Cement
Neutral
458
-
5,387
2,913
3,412
14.5
19.5
7.5
22.5
61.0
20.4
3.8
3.2
12.5
18.0
2.4
2.0
Orient Cement
Neutral
195
-
3,985
2,114
2,558
18.5
20.5
8.1
11.3
24.0
17.2
3.5
3.0
9.0
14.0
2.5
2.0
UltraTech Cement
Neutral
3,868
-
106,157
25,768
30,385
21.0
23.5
111.0
160.0
34.9
24.2
4.5
3.9
13.5
15.8
4.2
3.5
Construction
ITNL
Neutral
88
-
2,883
8,946
10,017
31.0
31.6
8.1
9.1
10.8
9.6
0.4
0.4
4.2
5.0
3.7
3.4
KNR Constructions
Buy
695
802
1,955
1,385
1,673
14.7
14.0
41.2
48.5
16.9
14.3
3.1
2.7
14.9
15.2
1.5
1.2
Larsen & Toubro
Buy
1,464
1,700
136,399
67,665
77,249
10.7
11.5
57.3
71.2
25.5
20.6
2.3
2.2
12.6
14.3
2.2
1.9
Gujarat Pipavav Port
Neutral
193
-
9,330
705
788
52.2
51.7
5.0
5.6
38.6
34.5
3.8
3.4
11.2
11.2
12.9
11.0
Nagarjuna Const.
Neutral
83
-
4,636
8,842
9,775
9.1
8.8
5.3
6.4
15.7
13.0
1.2
1.1
8.2
9.1
0.7
0.6
PNC Infratech
Buy
122
143
3,130
2,350
2,904
13.1
13.2
9.0
8.8
13.6
13.9
0.5
0.4
15.9
13.9
1.5
1.2
Simplex Infra
Neutral
337
-
1,667
6,829
7,954
10.5
10.5
31.4
37.4
10.7
9.0
1.1
1.0
9.9
13.4
0.7
0.6
Power Mech Projects
Neutral
464
-
682
1,801
2,219
12.7
14.6
72.1
113.9
6.4
4.1
1.2
1.0
16.8
11.9
0.4
0.3
Sadbhav Engineering
Neutral
296
-
5,082
3,598
4,140
10.3
10.6
9.0
11.9
32.9
24.9
3.4
3.0
9.9
11.9
1.7
1.4
NBCC
Neutral
245
-
14,700
7,428
9,549
7.9
8.6
8.2
11.0
29.9
22.3
1.5
1.2
28.2
28.7
1.7
1.3
MEP Infra
Neutral
43
-
695
1,877
1,943
30.6
29.8
3.0
4.2
14.3
10.2
6.9
4.7
0.6
0.6
1.8
1.6
SIPL
Neutral
104
-
3,647
1,036
1,252
65.5
66.2
(8.4)
(5.6)
3.9
4.4
(22.8)
(15.9)
11.7
9.8
Stock Watch
September 14, 2016
Company Name
Reco
CMP
Target
Mkt Cap
Sales ( Čcr )
OPM(%)
EPS (Č)
PER(x)
P/BV(x)
RoE(%)
EV/Sales(x)
(Č)
Price ( Č)
( Č cr )
FY17E
FY18E
FY17E
FY18E
FY17E
FY18E
FY17E
FY18E
FY17E
FY18E
FY17E
FY18E
FY17E
FY18E
Construction
Engineers India
Neutral
253
-
8,514
1,725
1,935
16.0
19.1
11.4
13.9
22.2
18.2
3.1
3.0
13.4
15.3
3.9
3.5
Financials
Axis Bank
Neutral
592
-
141,344
58,081
66,459
3.5
3.5
32.4
44.6
18.3
13.3
2.4
2.1
13.6
16.5
-
-
Bank of Baroda
Neutral
162
-
37,258
19,980
23,178
1.8
1.8
11.5
17.3
14.1
9.4
1.6
1.3
8.3
10.1
-
-
Canara Bank
Neutral
297
-
16,121
15,225
16,836
1.8
1.8
14.5
28.0
20.5
10.6
1.4
1.1
5.8
8.5
-
-
Dewan Housing Finance Buy
278
325
8,113
2,225
2,688
2.9
2.9
29.7
34.6
9.4
8.0
1.5
1.3
16.1
16.8
-
-
Equitas Holdings
Buy
176
235
5,889
939
1,281
11.7
11.5
5.8
8.2
30.3
21.4
2.6
2.3
10.9
11.5
-
-
Federal Bank
Neutral
71
-
12,182
9,353
10,623
2.9
2.9
4.4
5.8
16.1
12.2
1.5
1.4
9.5
11.0
-
-
HDFC
Neutral
1,395
-
220,489
11,475
13,450
3.4
3.4
45.3
52.5
30.8
26.6
5.9
5.2
20.2
20.5
-
-
HDFC Bank
Accumulate
1,280
1,350
324,050
46,097
55,433
4.5
4.5
58.4
68.0
21.9
18.8
3.8
3.2
18.8
18.6
-
-
ICICI Bank
Neutral
269
-
156,330
39,029
45,903
3.3
3.3
16.7
16.3
16.1
16.5
2.0
1.8
10.1
12.4
-
-
LIC Housing Finance
Neutral
561
-
28,286
3,712
4,293
2.6
2.5
39.0
46.0
14.4
12.2
2.7
2.3
19.9
20.1
-
-
Punjab Natl.Bank
Neutral
137
-
26,941
23,532
23,595
2.3
2.4
6.8
12.6
20.2
10.9
3.1
2.2
3.3
6.5
-
-
South Ind.Bank
Neutral
23
-
3,106
6,435
7,578
2.5
2.5
2.7
3.1
8.5
7.4
1.1
0.9
10.1
11.2
-
-
St Bk of India
Neutral
253
-
196,165
88,650
98,335
2.6
2.6
13.5
18.8
18.7
13.4
1.8
1.6
7.0
8.5
-
-
Union Bank
Neutral
141
-
9,700
13,450
14,925
2.3
2.3
25.5
34.5
5.5
4.1
0.8
0.7
7.5
10.2
-
-
Yes Bank
Neutral
1,205
-
50,745
8,978
11,281
3.3
3.4
74.0
90.0
16.3
13.4
3.1
2.6
17.0
17.2
-
-
RBL Bank
Accumulate
297
325
10,981
1,783
2,309
2.6
2.6
12.7
16.4
23.4
18.1
2.6
2.3
12.8
13.3
-
-
FMCG
Asian Paints
Neutral
1,154
-
110,735
17,128
18,978
16.8
16.4
19.1
20.7
60.4
55.8
21.0
19.8
34.8
35.5
6.4
5.8
Britannia
Neutral
3,418
-
41,004
9,795
11,040
14.6
14.9
80.3
94.0
42.6
36.4
17.5
13.5
41.2
-
4.1
3.5
Colgate
Neutral
978
-
26,604
4,605
5,149
23.4
23.4
23.8
26.9
41.1
36.4
22.8
17.8
64.8
66.8
5.7
5.1
Dabur India
Neutral
290
-
51,050
8,315
9,405
19.8
20.7
8.1
9.2
35.8
31.5
10.0
8.3
31.6
31.0
5.8
5.1
GlaxoSmith Con*
Neutral
6,086
-
25,595
4,350
4,823
21.2
21.4
179.2
196.5
34.0
31.0
9.0
7.6
27.1
26.8
5.3
4.7
Godrej Consumer
Neutral
1,613
-
54,920
10,235
11,428
18.4
18.6
41.1
44.2
39.2
36.5
8.7
7.3
24.9
24.8
5.4
4.8
HUL
Neutral
918
-
198,743
35,252
38,495
17.6
17.4
20.4
21.9
45.0
41.9
37.0
32.4
82.2
77.3
5.5
5.0
ITC
Accumulate
252
283
304,486
40,059
44,439
39.0
39.2
9.1
10.1
27.7
25.0
7.6
6.6
27.2
26.5
7.1
6.4
Marico
Neutral
288
-
37,183
6,430
7,349
18.8
19.5
6.4
7.7
45.0
37.4
13.6
11.4
33.2
32.5
5.6
4.8
Nestle*
Neutral
6,435
-
62,046
10,073
11,807
20.7
21.5
124.8
154.2
51.6
41.7
21.2
19.0
34.8
36.7
6.0
5.1
Tata Global
Neutral
135
-
8,539
8,675
9,088
9.8
9.8
7.4
8.2
18.3
16.5
2.1
2.0
7.9
8.1
0.9
0.8
Procter & Gamble
Accumulate
6,664
7,369
21,631
2,939
3,342
23.2
23.0
146.2
163.7
45.6
40.7
102.1
97.9
25.3
23.5
6.9
6.0
Hygiene
Stock Watch
September 14, 2016
Company Name
Reco
CMP
Target
Mkt Cap
Sales ( Čcr )
OPM(%)
EPS (Č)
PER(x)
P/BV(x)
RoE(%)
EV/Sales(x)
(Č)
Price ( Č)
( Č cr )
FY17E FY18E
FY17E
FY18E
FY17E
FY18E
FY17E
FY18E
FY17E
FY18E
FY17E
FY18E
FY17E
FY18E
IT
HCL Tech^
Buy
783
1,000
110,392
49,242
57,168
20.5
20.5
55.7
64.1
14.1
12.2
2.9
2.2
20.3
17.9
2.1
1.7
Infosys
Buy
1,054
1,370
242,098
69,934
79,025
27.5
27.5
64.8
72.0
16.3
14.6
3.6
3.3
22.0
22.3
2.9
2.5
TCS
Buy
2,359
3,004
464,844
121,684
136,286
27.3
27.3
135.0
150.1
17.5
15.7
5.8
5.3
33.2
33.9
3.6
3.1
Tech Mahindra
Buy
464
700
45,021
30,347
33,685
17.0
17.0
37.5
41.3
12.4
11.2
2.7
2.3
21.8
20.7
1.2
1.0
Wipro
Buy
481
680
116,991
51,631
55,822
21.7
17.9
35.9
36.9
13.4
13.0
2.8
2.6
19.0
18.1
2.0
1.7
Media
D B Corp
Neutral
400
-
7,343
2,297
2,590
27.4
28.2
21.0
23.4
19.0
17.1
4.4
3.8
23.7
23.1
3.0
2.6
HT Media
Neutral
82
-
1,912
2,693
2,991
12.6
12.9
7.9
9.0
10.4
9.1
0.9
0.8
7.8
8.3
0.3
0.2
Jagran Prakashan
Buy
189
225
6,185
2,355
2,635
28.0
28.0
10.8
12.5
17.5
15.1
3.8
3.3
21.7
21.7
2.6
2.3
Sun TV Network
Neutral
452
-
17,809
2,850
3,265
70.1
71.0
26.2
30.4
17.3
14.9
4.4
3.9
24.3
25.6
5.8
5.0
Hindustan Media
Neutral
281
-
2,064
1,016
1,138
24.3
25.2
27.3
30.1
10.3
9.3
2.0
1.7
16.2
15.8
1.4
1.2
Ventures
TV Today Network
Buy
298
363
1,778
637
743
27.5
27.5
18.4
21.4
16.2
13.9
2.8
2.4
17.4
17.2
2.4
2.0
Metals & Mining
Coal India
Neutral
331
-
208,882
84,638
94,297
21.4
22.3
24.5
27.1
13.5
12.2
5.6
5.4
42.6
46.0
2.0
1.8
Hind. Zinc
Neutral
212
-
89,619
14,252
18,465
55.9
48.3
15.8
21.5
13.4
9.9
2.2
1.9
17.0
20.7
6.3
4.9
Hindalco
Neutral
141
-
29,075
107,899
112,095
7.4
8.2
9.2
13.0
15.3
10.8
0.7
0.7
4.8
6.6
0.8
0.7
JSW Steel
Neutral
1,745
-
42,182
53,201
58,779
16.1
16.2
130.6
153.7
13.4
11.4
1.8
1.6
14.0
14.4
1.6
1.3
NMDC
Neutral
105
-
41,451
6,643
7,284
44.4
47.7
7.1
7.7
14.7
13.6
1.3
1.2
8.8
9.2
4.0
3.6
SAIL
Neutral
48
-
19,783
47,528
53,738
(0.7)
2.1
(1.9)
2.6
18.4
0.5
0.5
(1.6)
3.9
1.3
1.2
Vedanta
Neutral
161
-
47,821
71,744
81,944
19.2
21.7
13.4
20.1
12.0
8.0
1.0
0.9
8.4
11.3
1.1
0.8
Tata Steel
Neutral
374
-
36,285
121,374
121,856
7.2
8.4
18.6
34.3
20.1
10.9
1.3
1.2
6.1
10.1
0.9
0.9
Oil & Gas
Cairn India
Neutral
189
-
35,426
9,127
10,632
4.3
20.6
8.8
11.7
21.5
16.2
0.7
0.7
3.3
4.2
5.3
4.4
GAIL
Neutral
385
-
48,893
56,220
65,198
9.3
10.1
27.1
33.3
14.2
11.6
1.3
1.2
9.3
10.7
1.1
0.9
ONGC
Neutral
251
-
214,871
137,222
152,563
15.0
21.8
19.5
24.1
12.9
10.4
1.1
1.0
8.5
10.1
1.8
1.6
Indian Oil Corp
Neutral
553
-
134,254
373,359
428,656
5.9
5.5
54.0
59.3
10.2
9.3
1.6
1.4
16.0
15.6
0.5
0.4
Reliance Industries
Neutral
1,047
-
339,354
301,963
358,039
12.1
12.6
87.7
101.7
11.9
10.3
1.2
1.1
10.7
11.3
1.6
1.3
Pharmaceuticals
Alembic Pharma
Neutral
627
-
11,817
3,483
4,083
20.2
21.4
24.3
30.4
25.8
20.6
5.9
4.7
25.5
25.3
3.3
2.8
Aurobindo Pharma
Accumulate
784
877
45,863
15,720
18,078
23.7
23.7
41.4
47.3
18.9
16.6
4.9
3.9
29.6
26.1
3.1
2.7
Sanofi India*
Neutral
4,300
-
9,904
2,357
2,692
17.3
17.3
153.5
169.2
28.0
25.4
4.8
3.8
25.8
28.4
3.9
3.2
Cadila Healthcare
Neutral
382
-
39,081
11,126
13,148
22.0
22.0
17.1
20.0
22.3
19.1
5.7
4.6
28.8
26.6
3.5
2.9
Cipla
Reduce
569
490
45,715
15,378
18,089
17.4
18.4
21.6
27.2
26.3
20.9
3.4
3.0
13.7
15.2
3.2
2.6
Stock Watch
September 14, 2016
Company Name
Reco
CMP
Target
Mkt Cap
Sales ( Čcr )
OPM(%)
EPS (Č)
PER(x)
P/BV(x)
RoE(%)
EV/Sales(x)
(Č)
Price ( Č)
( Č cr )
FY17E FY18E
FY17E
FY18E
FY17E
FY18E
FY17E
FY18E
FY17E
FY18E
FY17E
FY18E
FY17E
FY18E
Pharmaceuticals
Dr Reddy's
Neutral
3,138
-
52,003
16,043
18,119
23.1
24.7
126.0
157.8
24.9
19.9
3.7
3.2
15.7
17.1
3.2
2.8
Dishman Pharma
Sell
171
45
2,765
1,718
1,890
22.7
22.8
9.5
11.3
18.0
15.2
1.7
1.6
10.1
10.9
2.1
1.8
GSK Pharma*
Neutral
2,981
-
25,248
3,528
3,811
16.6
18.8
51.8
59.4
57.5
50.2
15.4
15.3
26.3
30.6
6.9
6.5
Indoco Remedies
Sell
314
225
2,898
1,112
1,289
18.2
18.2
13.2
15.6
23.8
20.2
4.2
3.6
19.2
19.2
2.7
2.3
Ipca labs
Accumulate
573
613
7,233
3,303
3,799
15.3
15.3
17.3
19.7
33.1
29.1
2.9
2.6
9.1
9.4
2.3
2.0
Lupin
Buy
1,533
1,809
69,114
15,912
18,644
26.4
26.7
58.1
69.3
26.4
22.1
5.1
4.2
21.4
20.9
4.4
3.6
Sun Pharma
Buy
787
944
189,395
31,129
35,258
30.0
30.9
28.0
32.8
28.1
24.0
4.3
3.6
18.7
18.9
5.7
4.8
Power
Tata Power
Neutral
74
-
20,095
36,916
39,557
17.4
27.1
5.1
6.3
14.6
11.8
1.3
1.2
9.0
10.3
1.6
1.4
NTPC
Neutral
153
-
126,238
86,605
95,545
17.5
20.8
11.8
13.4
13.0
11.4
1.3
1.2
10.5
11.1
2.8
2.8
Power Grid
Neutral
180
-
94,352
25,763
29,762
74.3
73.1
14.8
17.3
12.2
10.4
1.9
1.7
16.9
17.5
7.9
7.5
Real Estate
MLIFE
Buy
429
522
1,759
1,152
1,300
22.7
24.6
29.9
35.8
14.3
12.0
1.1
1.0
7.6
8.6
2.2
1.9
Telecom
Bharti Airtel
Neutral
318
-
127,117
105,086
114,808
34.5
34.7
12.2
16.4
26.1
19.4
1.8
1.6
6.8
8.4
2.1
1.8
Idea Cellular
Neutral
83
-
29,815
40,133
43,731
37.2
37.1
6.4
6.5
12.9
12.7
1.1
1.0
8.2
7.6
1.8
1.5
zOthers
Abbott India
Neutral
4,594
-
9,762
3,153
3,583
14.1
14.4
152.2
182.7
30.2
25.2
148.2
126.6
25.6
26.1
2.8
2.4
Bajaj Electricals
Accumulate
271
306
2,735
5,099
5,805
5.6
5.9
11.4
14.6
23.8
18.6
3.2
2.8
13.4
15.1
0.5
0.5
Finolex Cables
Neutral
432
-
6,605
2,883
3,115
12.0
12.1
14.2
18.6
30.4
23.2
16.2
14.1
15.8
14.6
2.0
1.8
Goodyear India*
Buy
590
684
1,361
1,598
1,704
10.4
10.2
49.4
52.6
11.9
11.2
55.1
48.4
18.2
17.0
0.5
71.9
Hitachi
#VALUE!
2,081
2,433
8.8
8.9
33.4
39.9
22.1
21.4
Jyothy Laboratories
Neutral
321
-
5,822
1,440
2,052
11.5
13.0
8.5
10.0
37.8
32.1
9.2
8.5
18.6
19.3
4.3
3.0
Page Industries
Neutral
14,392
-
16,053
2,450
3,124
20.1
17.6
299.0
310.0
48.1
46.4
320.5
244.7
47.1
87.5
6.6
5.2
Relaxo Footwears
Neutral
429
-
5,147
2,085
2,469
9.2
8.2
7.6
8.0
56.7
54.0
22.0
18.8
17.9
18.8
2.6
2.2
Siyaram Silk Mills
Buy
1,235
1,469
1,158
1,799
2,040
11.6
11.7
104.9
122.4
11.8
10.1
1.9
1.7
16.4
16.4
0.8
0.7
Styrolution ABS India*
Neutral
563
-
989
1,440
1,537
9.2
9.0
40.6
42.6
13.9
13.2
35.4
32.2
12.3
11.6
0.6
0.6
TVS Srichakra
Accumulate
2,631
2,932
2,015
2,304
2,614
13.7
13.8
231.1
266.6
11.4
9.9
295.7
232.8
33.9
29.3
0.9
0.7
HSIL
Neutral
340
-
2,456
2,384
2,515
15.8
16.3
15.3
19.4
22.2
17.5
22.1
19.0
7.8
9.3
1.2
1.1
Kirloskar Engines India
Neutral
292
-
4,218
2,554
2,800
9.9
10.0
10.5
12.1
27.8
24.1
11.6
11.0
10.7
11.7
1.3
1.1
Ltd
M M Forgings
Neutral
419
-
506
546
608
20.4
20.7
41.3
48.7
10.2
8.6
57.5
50.8
16.6
17.0
0.8
0.7
Banco Products (India)
Neutral
215
-
1,536
1,353
1,471
12.3
12.4
14.5
16.3
14.8
13.2
20.5
18.4
14.5
14.6
1.1
115.5
Competent Automobiles Neutral
200
-
123
1,137
1,256
3.1
2.7
28.0
23.6
7.1
8.5
38.5
34.8
14.3
11.5
0.1
0.1
Stock Watch
September 14, 2016
Company Name
Reco
CMP
Target
Mkt Cap
Sales ( Čcr )
OPM(%)
EPS (Č)
PER(x)
P/BV(x)
RoE(%)
EV/Sales(x)
(Č)
Price ( Č)
( Č cr )
FY17E
FY18E
FY17E
FY18E
FY17E
FY18E
FY17E
FY18E
FY17E
FY18E
FY17E
FY18E
FY17E
FY18E
zOthers
Nilkamal
Neutral
1,306
-
1,949
1,995
2,165
10.7
10.4
69.8
80.6
18.7
16.2
74.6
64.8
16.6
16.5
1.0
0.9
Visaka Industries
Neutral
192
-
305
1,051
1,138
10.3
10.4
21.0
23.1
9.1
8.3
24.6
23.0
9.0
9.2
0.6
0.5
Transport Corporation of
Neutral
184
-
1,408
2,671
2,911
8.5
8.8
13.9
15.7
13.3
11.7
1.8
1.6
13.7
13.8
0.6
0.6
India
Elecon Engineering
Accumulate
57
63
622
1,482
1,660
13.7
14.5
3.9
5.8
14.6
9.8
3.4
3.2
7.8
10.9
0.7
0.7
Surya Roshni
Neutral
192
-
841
3,342
3,625
7.8
7.5
17.3
19.8
11.1
9.7
21.1
16.9
10.5
10.8
0.5
0.5
MT Educare
Neutral
127
-
506
366
417
17.7
18.2
9.4
10.8
13.6
11.8
3.0
2.6
22.2
22.3
1.3
1.1
Radico Khaitan
Buy
104
125
1,377
1,659
1,802
13.0
13.2
6.3
7.4
16.3
14.0
1.4
1.3
8.6
9.3
1.3
1.2
Garware Wall Ropes
Neutral
501
-
1,096
873
938
12.9
13.1
30.9
34.9
16.2
14.4
2.5
2.2
15.7
15.2
1.2
1.1
Wonderla Holidays
Neutral
401
-
2,263
287
355
38.0
40.0
11.3
14.2
35.4
28.2
5.1
4.4
21.4
23.9
7.6
6.1
Linc Pen & Plastics
Neutral
281
-
415
382
420
9.3
9.5
13.5
15.7
20.9
17.9
3.6
3.1
17.1
17.3
1.2
1.0
The Byke Hospitality
Neutral
158
-
633
287
384
20.5
20.5
7.6
10.7
20.8
14.8
4.3
3.5
20.7
23.5
2.2
1.7
Interglobe Aviation
Neutral
865
-
31,169
21,122
26,005
14.5
27.6
110.7
132.1
7.8
6.6
46.8
33.4
168.5
201.1
1.5
1.1
Coffee Day Enterprises
Neutral
235
-
4,841
2,964
3,260
20.5
21.2
4.7
8.0
-
29.4
2.7
2.5
5.5
8.5
2.0
1.8
Ltd
Navneet Education
Neutral
104
-
2,466
1,062
1,147
24.0
24.0
6.1
6.6
17.0
15.6
3.5
3.1
20.6
19.8
2.4
2.2
Navkar Corporation
Buy
195
265
2,787
408
612
42.9
42.3
6.8
11.5
28.9
17.0
2.0
1.8
6.9
10.5
7.7
5.2
UFO Moviez
Neutral
426
-
1,176
619
685
33.2
33.4
30.0
34.9
14.2
12.2
2.0
1.7
13.8
13.9
1.6
1.3
VRL Logistics
Neutral
291
-
2,659
1,902
2,119
16.7
16.6
14.6
16.8
20.0
17.3
4.4
3.9
21.9
22.2
1.5
1.3
Team Lease Serv.
Neutral
1,085
-
1,855
3,229
4,001
1.5
1.8
22.8
32.8
47.7
33.0
5.1
4.4
10.7
13.4
0.5
0.4
S H Kelkar & Co.
Neutral
301
-
4,355
1,036
1,160
15.1
15.0
6.1
7.2
49.3
42.0
5.3
4.8
10.7
11.5
4.1
3.6
Quick Heal
Neutral
225
-
1,573
408
495
27.3
27.0
7.7
8.8
29.0
25.5
2.7
2.7
9.3
10.6
3.0
2.5
Narayana Hrudaya
Neutral
312
-
6,366
1,873
2,166
11.5
11.7
2.6
4.0
117.8
78.6
7.2
6.5
6.1
8.3
3.5
3.0
Manpasand Bever.
Neutral
718
-
3,592
836
1,087
19.6
19.4
16.9
23.8
42.5
30.1
5.1
4.5
12.0
14.8
4.0
3.0
Parag Milk Foods
Neutral
332
-
2,791
1,919
2,231
9.3
9.6
9.5
12.9
35.1
25.7
5.5
4.5
15.5
17.5
1.6
1.4
Mirza International
Buy
87
113
1,050
1,024
1,148
18.0
18.0
6.9
8.0
12.7
10.9
2.1
1.8
16.6
16.2
1.2
1.1
Source: Company, Angel Research; Note: *December year end; #September year end; &October year end; Price as on September 12, 2016
Market Outlook
September 14, 2016
Research Team Tel: 022 - 39357800
DISCLAIMER
Angel Broking Private Limited (hereinafter referred to as “Angel”) is a registered Member of National Stock Exchange of India
Limited,Bombay Stock Exchange Limited and Metropolitan Stock Exchange Limited. It is also registered as a Depository Participant with
CDSL and Portfolio Manager with SEBI. It also has registration with AMFI as a Mutual Fund Distributor. Angel Broking Private Limited is a
registered entity with SEBI for Research Analyst in terms of SEBI (Research Analyst) Regulations, 2014 vide registration number
INH000000164. Angel or its associates has not been debarred/ suspended by SEBI or any other regulatory authority for accessing
/dealing in securities Market. Angel or its associates/analyst has not received any compensation / managed or
co-managed public offering of securities of the company covered by Analyst during the past twelve months.
This document is solely for the personal information of the recipient, and must not be singularly used as the basis of any investment
decision. Nothing in this document should be construed as investment or financial advice. Each recipient of this document should make
such investigations as they deem necessary to arrive at an independent evaluation of an investment in the securities of the companies
referred to in this document (including the merits and risks involved), and should consult their own advisors to determine the merits and
risks of such an investment.
Reports based on technical and derivative analysis center on studying charts of a stock's price movement, outstanding positions and
trading volume, as opposed to focusing on a company's fundamentals and, as such, may not match with a report on a company's
fundamentals. Investors are advised to refer the Fundamental and Technical Research Reports available on our website to evaluate the
contrary view, if any.
The information in this document has been printed on the basis of publicly available information, internal data and other reliable
sources believed to be true, but we do not represent that it is accurate or complete and it should not be relied on as such, as this
document is for general guidance only. Angel Broking Pvt. Limited or any of its affiliates/ group companies shall not be in any way
responsible for any loss or damage that may arise to any person from any inadvertent error in the information contained in this report.
Angel Broking Pvt. Limited has not independently verified all the information contained within this document. Accordingly, we cannot
testify, nor make any representation or warranty, express or implied, to the accuracy, contents or data contained within this document.
While Angel Broking Pvt. Limited endeavors to update on a reasonable basis the information discussed in this material, there may be
regulatory, compliance, or other reasons that prevent us from doing so.
This document is being supplied to you solely for your information, and its contents, information or data may not be reproduced,
redistributed or passed on, directly or indirectly.
Neither Angel Broking Pvt. Limited, nor its directors, employees or affiliates shall be liable for any loss or damage that may arise from
or in connection with the use of this information.